Unit 1: Geography, Government and Economics, Oh My!
LESSON 3:
THEMATIC MAPS & MAP SKILLS
Topic 1: Geography 101
LESSON MISSION

Activity 1: Write the Lesson Mission Statements below in your Lesson Chronicles on the Lesson 3 Thematic Maps & Map Skills Page found under the header "Lesson Mission."
- I can define the term, "thematic map."
- I can identify and describe the five parts of a map.
- I can use thematic maps to gather information about places.
- I can find the location of a place using latitude and longitude.
READ ABOUT IT!
|
Activity 2: Read the Lesson 3 Text below. Match the vocabulary words and their definitions in your Lesson Chronicles under the Lesson Vocabulary header.
THEMATIC MAPSA thematic map is a map that focuses on one main idea or theme and uses colors or pictures to show how different places relate to each other in regards to that theme. There are many different ideas that thematic maps show about regions. Some of these are natural resources, vegetation areas, population, types of soil, climate, and temperature.
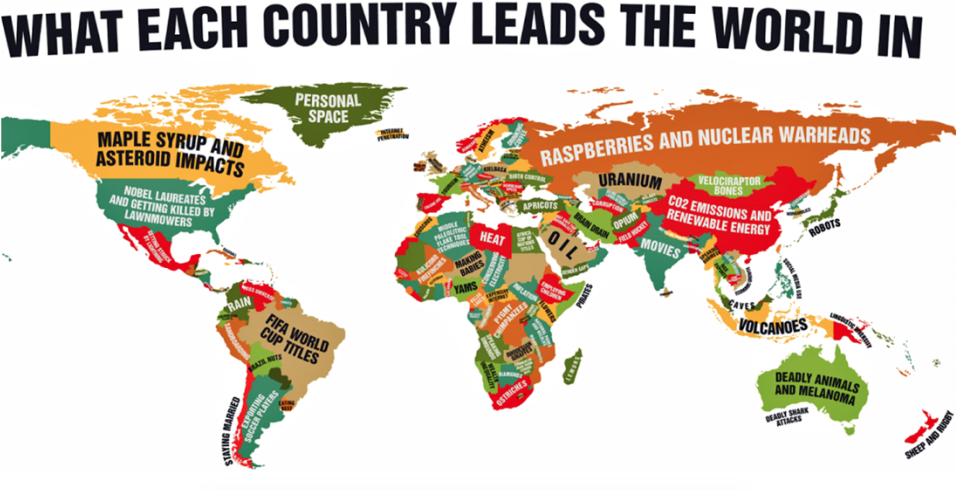
Thematic maps display information about a region using colors, pictures, and symbols. Look at the examples below.
Types of Thematic MapsChoropleth Maps
Below you will see different examples of choropleth maps. A cloropleth map is a thematic map in which areas are colored or shaded to represent similarities and differences in the theme.
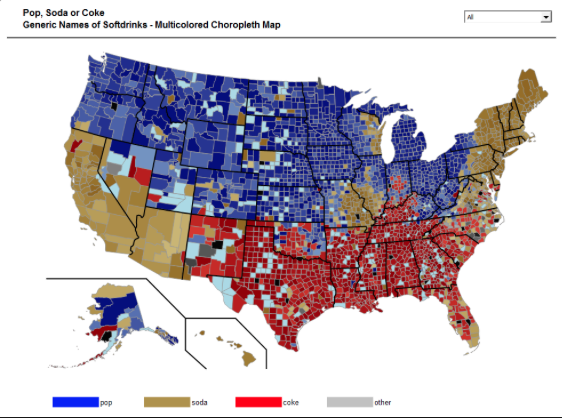
This map shows the different areas that refer to softdrinks as Pop, Soda, or Coke. Notice how small blocks of color represent each county in the U.S. Do you see the mistake in this map? (Hint: Look at the Legend and then at the map.)
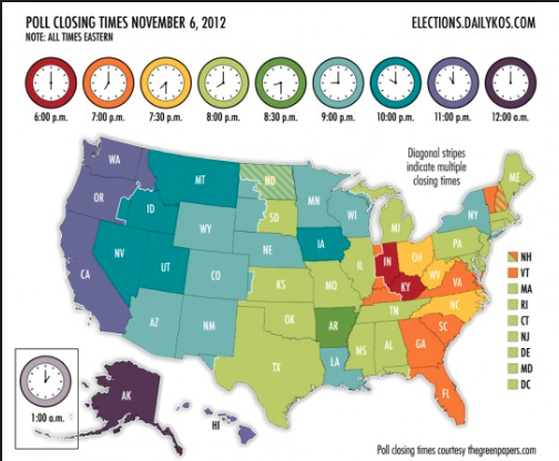
This map shows the times that polls closed across the nation in the 2012 elections.
Isoline Maps
Below you will see different examples of isoline maps. A isoline map is a thematic map where lines are drawn to link different places that share a common theme and filled in with color to show contrasts of the theme.
The map above does a wonderful job of showing the lines that connect areas with the same temperature and filled in with color to show the contrasts in temperature. Have you seen a map like this before? Who might use this type of map on a regular basis?
|
TOOL BOX
thematic map: a map that focuses on one main idea or theme and uses colors or pictures to show how different places relate to each other in regards to that theme
cloropleth map: a thematic map in which areas are colored or shaded to represent similarities and differences in the theme isoline map: a thematic map where lines are drawn to link different places that share a common theme and filled in with color to show contrasts of the theme precipitation: any form of water that falls from the sky to the ground including rain, snow, sleet, or hail weather: the temperature, cloudiness, humidity, and storms that occur over a few days time climate: the average weather in a place over many years dot density map: a thematic map where dots are used to show how concentrated an area is in regard to the theme graduated symbol map: a thematic map that uses a symbol in different sizes to show amounts flow map: a thematic map that shows the movement of goods, people, and ideas between places by drawing lines connecting those places map title: the largest or first words on the map that tell the theme of the map or what the map is about compass rose: the symbol on the map that shows you cardinal directions and intermediate directions cardinal directions: the basic directions of north, south, east and west intermediate directions: northwest, northeast, southwest, and southeast map key or legend: the part of the map that explains what the symbols an colors of the map represent map scales: show the ratio to which the map was scaled down in size grid system: a coordinate plane system on a map that uses vertical lines called longitude and horizontal lines called latitude, to pinpoint locations on Earth Lines of latitude: imaginary horizontal lines around the earth that measure north-south position between the North and South Poles equator: an imaginary line around the earth that is located at 0 degrees latitude North Pole: an imaginary line of latitude around the earth that is located at 90 degrees north South Pole: an imaginary line of latitude around the earth that is located at 90 degrees south lines of longitude: imaginary vertical lines that measure east-west position between the North and South Poles prime meridian: an imaginary vertical line of longitude that is assigned the value of 0 degrees and runs through Greenwich, England |
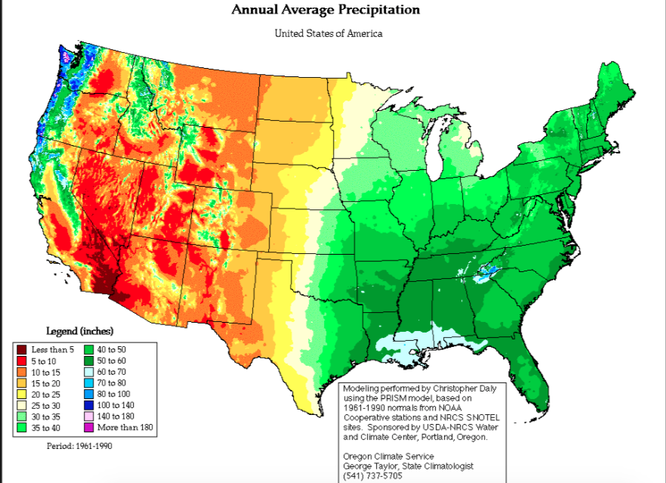
The map above shows the differences in precipitation across the United States. Precipitation is any form of water that falls from the sky to the ground. Precipitation can be rain, snow, sleet, or hail. Which area has the most precipitation?
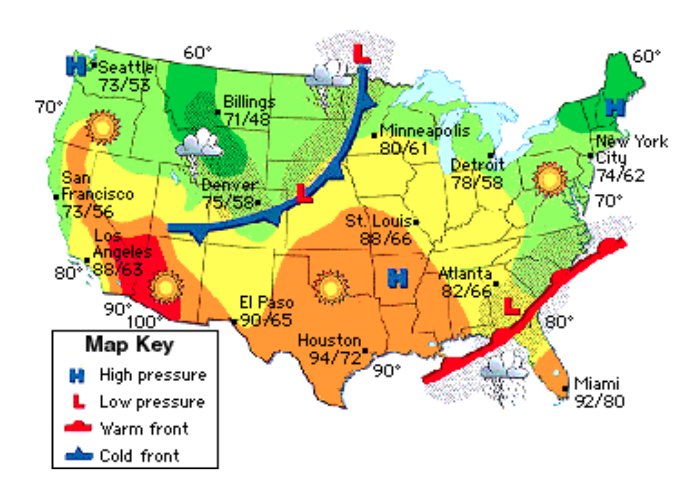
The map above shows the weather across the United States on a specific day. Weather is what the forecasters on the TV news predict each day. They tell people about the temperature, cloudiness, humidity, and whether a storm is likely in the next few days. It is the mix of events that happens each day in our atmosphere. Weather is not the same everywhere. It may be hot and sunny in one part of the world, but freezing and snowy in another. This particular map shows air pressure, fronts, temperatures, and precipitation across the United States one day.
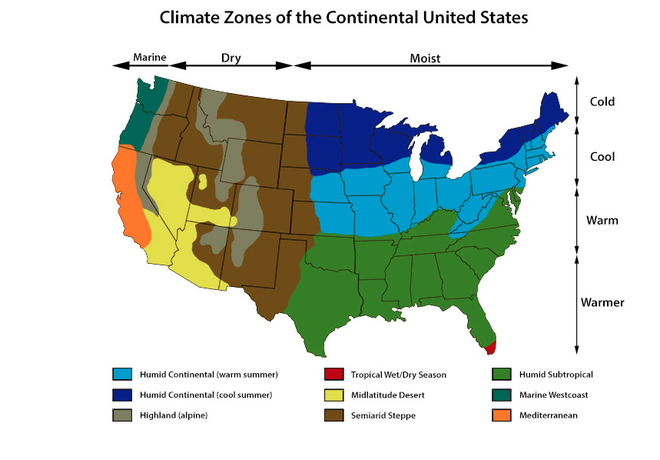
The map above shows the differences in climate across the United States. Climate is the average weather in a place over many years. Can you explain the difference in weather and climate?
Dot Density Maps
Below you will see different examples of dot density maps. A dot density map is a thematic map where dots are used to show how concentrated an area is in regard to the theme.
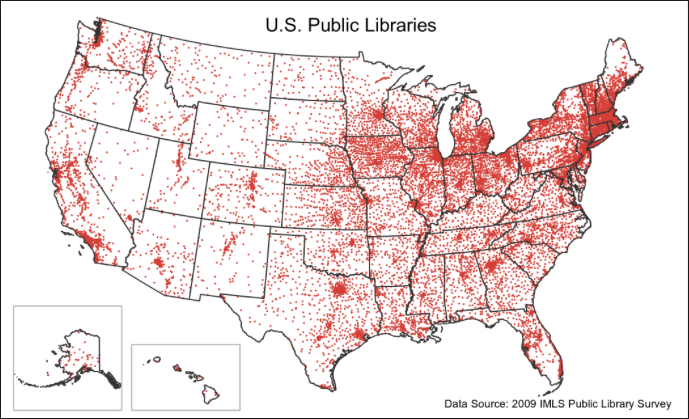
The map above shows the concentration of public libraries over the United States. What is meant by the word, "concentrated?" How would use describe it based upon what you see in the map above?
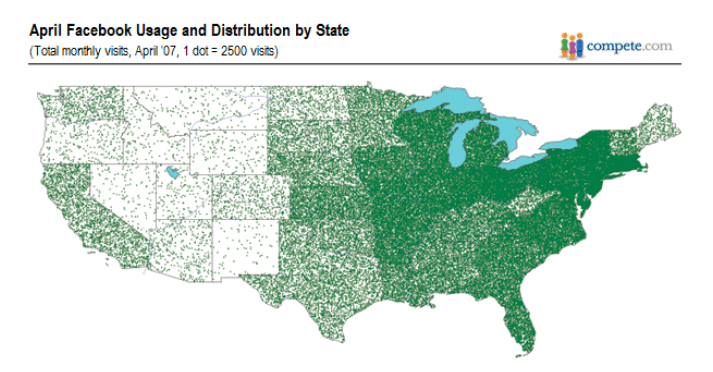
The map above shows the amount of time people spent on Facebook in the United States. Which areas visit Facebook the most? Which areas visit Facebook the least?
Graduated Symbol Maps
Below you will see different examples of graduated symbol maps. A graduated symbol map is a thematic map
that uses a symbol in different sizes to show amounts.
that uses a symbol in different sizes to show amounts.
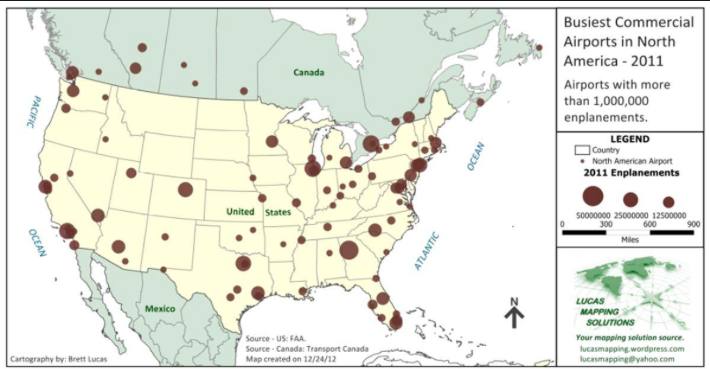
The map above uses red circles to show the busiest airports in the United States. The bigger the red circle, the busier the airport.
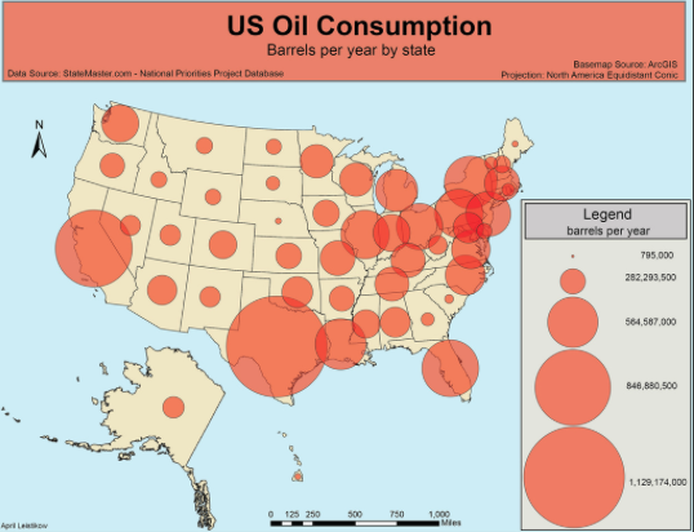
The map above uses peach colored circles to show the areas that use the most oil in the United States. Bigger circles show that more oil is used in that area.
Flow Maps
Below you will see different examples of flow maps. A flow map is a thematic map that shows the movement of goods, people, and ideas between places by drawing lines connecting those places.
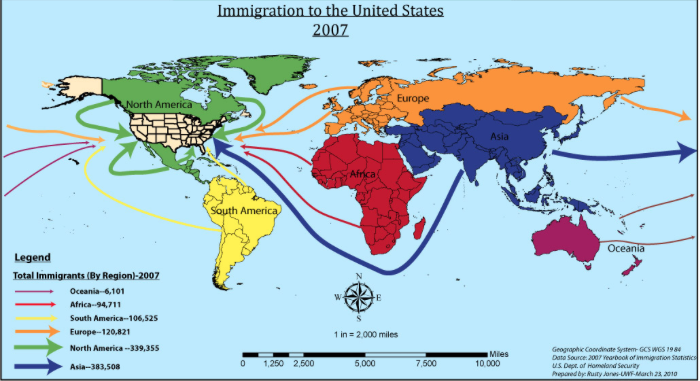
The flow map above shows the numbers of people who moved to the United States by continent in 2007.

The map above shows the path of the Ebola virus spreading around the world. Where did the Ebola virus start? Which country had the most people affected by the Ebola virus after it spread?
Parts of a Map
There are 5 major major parts to a map. These are:
- Title
- Compass Rose
- Key or Legend
- Scale
- Grid System
|
The Title
The first thing you should look at when reading a map is the map title. The map title is the largest or the first words on a map that tells you the theme of the map or what the map is about.
When a map does not have a title it can be difficult to understand what the map is telling you. |
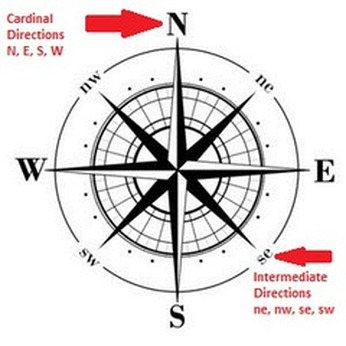
The Compass Rose
The compass rose is the symbol on the map that shows you cardinal directions and intermediate directions. Cardinal directions are the basic directions of north, south, east and west. Intermediate directions are northwest, northeast, southwest, and southeast. Intermediate directions combine cardinal directions to be more specific about a place's location on the map.
|
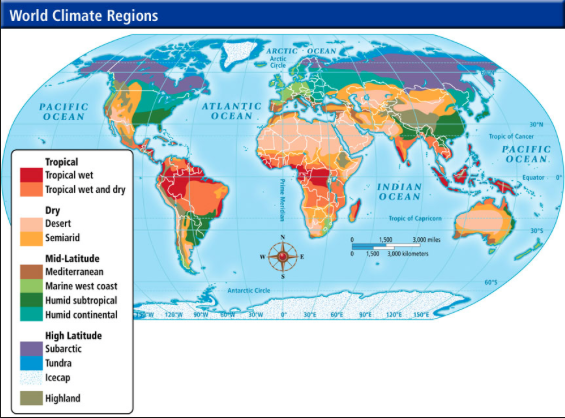
The title of this map is "World Climate Regions."
|
|
|
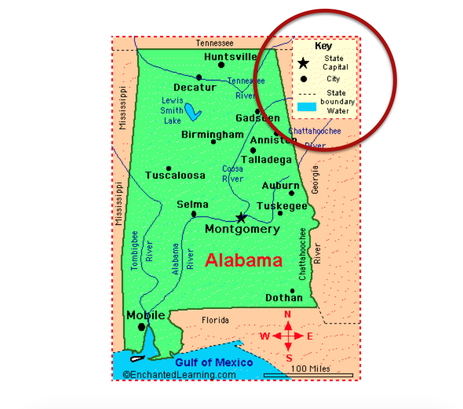
The Key or Legend
The map key or legend is the part of the map that explains what the symbols an colors of the map represent. It is usually found in a box somewhere on the map.
|
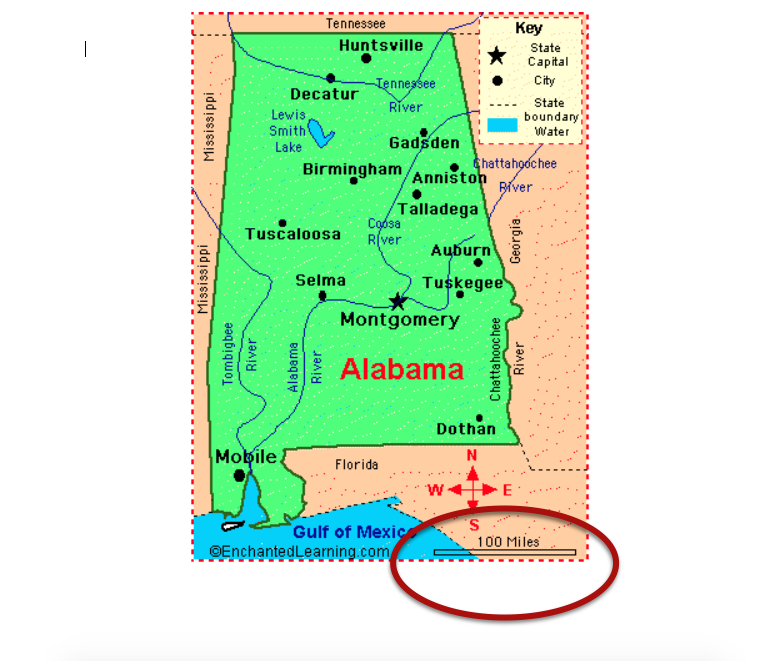
The Scale
Map scales show the ratio to which the map was scaled down in size. Maps are scaled down so that they fit on the available paper or screen. When scaling down a map, every part of the map is scaled by the same amount to make sure every object on the map is the same proportion as everything else on the map.
|
The Grid System
The grid system of a map uses vertical lines called longitude and horizontal lines called latitude, to pinpoint locations on Earth. The location of a place is the point at which a line of latitude and line of longitude intersect.
|
Lines of Latitude
Lines of latitude are imaginary lines that measure north-south position between the North and South Poles. The equator is located at 0 degrees latitude. The North Pole is located at 90 degrees north and the South Pole is located at 90 degrees south. Lines of latitude are all parallel to each other so they are often called parallels. Lines of latitude are horizontal lines.
|
Lines of Longitude
Lines of longitude are imaginary lines that measure east-west position between the north and South Poles. They are sometimes called meridians. The prime meridian is assigned the value of 0 degrees, and runs through Greenwich, England. Meridians to the west of the prime meridian are measured in degrees west and those to the east of the prime meridian are measured to by their number of degrees east.
|
PRACTICE IT!
Activity 3: Practice the type of maps and map terms you learned by playing the Thematic Maps Speed Match game below. Play as many times as you can until time is called. Try to improve your score each time. When you are asked to put your name in for the score use your last name and your computer number. So if I have computer 17, I would type in Smith17.

APPLY IT!
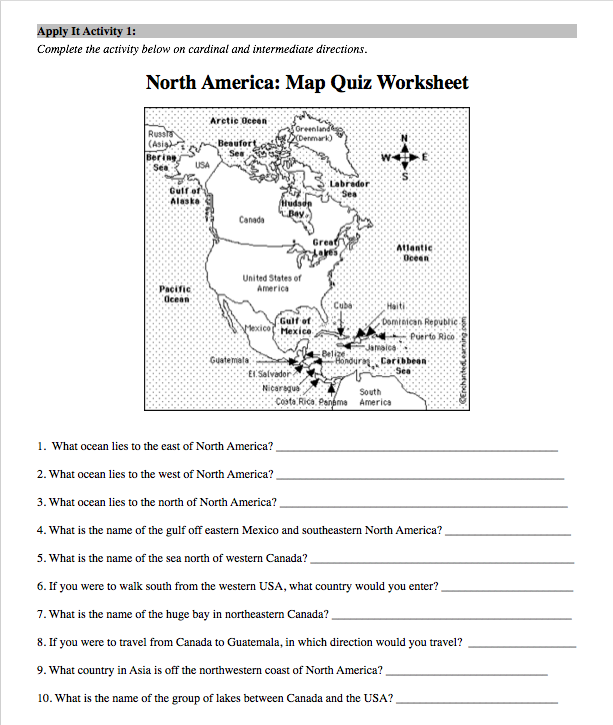
Activity 4: Use the Lesson reading above to to complete the map activities below in your Lesson Chronicles. You will find this activity in your Lesson 3 Chronicles under the header, "APPLY IT ACTIVITY!"
Apply It Activity 1
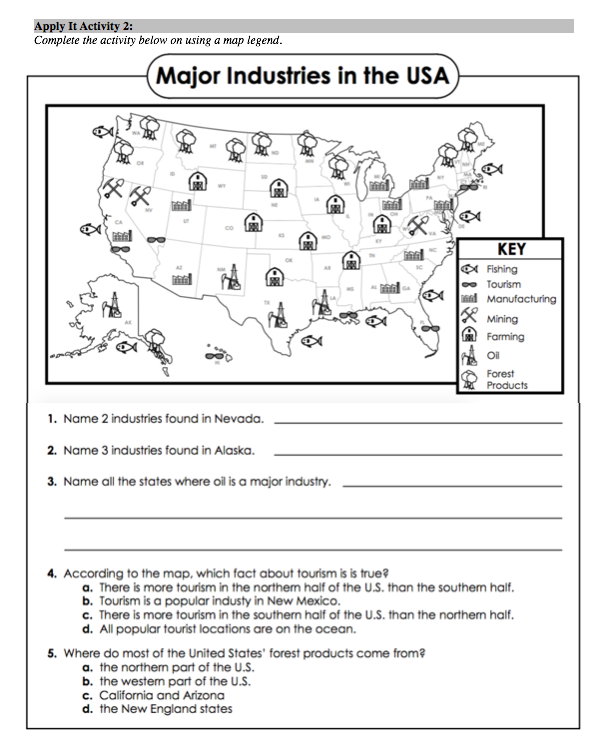
Apply It Activity 2
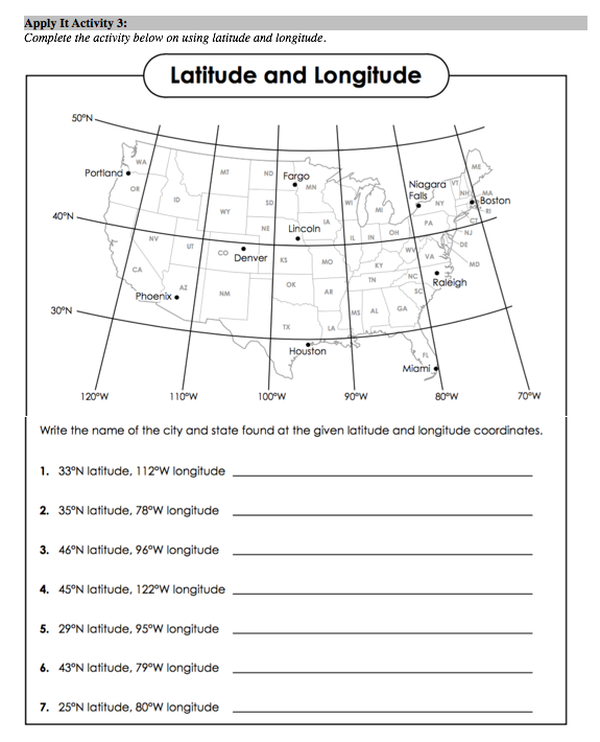
Apply It Activity 3
MAKE IT!
Activity 5: In this activity, you will use Google Maps to create your own thematic map in your Lesson 3 Chronicles under the Make It header. To do this click on the Google Maps link below. Look at the map of Moody. Use the Map guide in your Chronicles to draw a thematic map of Moody. You have a lot of room for creativity. You can show stores and restaurants. You could show residential areas or schools. Use your imagination. The only criteria you have is that it must use the five elements of maps and it must show accurate information.

MISSION ACCOMPLISHED!
Activity 6: Did you accomplish your mission for this lesson?
Are you able to say the following I can statements?
- I can define the term, "thematic map."
- I can identify and describe the five parts of a map.
- I can use thematic maps to gather information about places.
- I can find the location of a place using latitude and longitude.
LESSON COMPLETE!

You have completed Lesson 3 - Thematic Maps & Map Skills. Click on the button below to go back to the Topic 1 - Geography 101 Homepage
You have completed Lesson 3 - Thematic Maps & Map Skills. Click on the button below to go back to the Topic 1 - Geography 101 Homepage